Design Outline 0.5 Milestone
Introduction
I really want to get the Workbench to a point that it can be used by real people on real problems. And I would like that to happen as soon as possible.
This milestone should take the software a lot closer to getting the software released. Still not there, but a lot closer.
Output
The program is intended to solve constraint models and permit the user to visualize the result in a variety of ways. Plainly, creating the model and the output will be an iterative process of refining both the model and the visualization of the solution.
Sharing
I expect users will want to send the file to relevant stake holders so they can view the visualization themselves. The recipient will plainly need to have the Workbench installed at their end to make any use of it.
Some kind of export mechanism will be needed for easy sharing of the solution through well known formats like PDF and perhaps Microsoft Excel, Microsoft Word and/or Open Document format.
Visualizers
Currently the software supports very rudimentary chess board and table visualizers. The chess board will probably be removed from the software in due course when the other visualizers are capable enough to adequately replace it. Or, perhaps the chess board could be retained as a pre-configured table.
The table visualizer must be enhanced to include the following capabilities:
- Insert a column before or after selected column
- Insert a row before or after of selected row
- Edit cell content which may include text or image
- Coloring of text in cell as well as cell background.
- Edit column / row / cell borders including size / color of column / row / cell borders
- Delete selected row
- Delete selected column
- Merge cells
- Split merged cells
The visualizer will also need a set of properties that can be changed when the appropriate part of the visualizer is selected. For instance, when a cell is selected, things like the background color, foreground color and content must be editable. The properties should also be bindable to values outputted by the solver. So, for instance, a solution to the Australian map problem would have a set of values tied to the color assigned to the state. A cell background should be able to be bound to that value.
The entire solution display should be able to receive paint commands. It should be possible to paint the Australian continent or import an image and outline parts of the image that can be bound to values from the solution. So, for instance, import an image of Australia then outline the different states and then bind the color to the value in the solution for that state.
The table should also just be one of the things that can be painted onto the solution display.
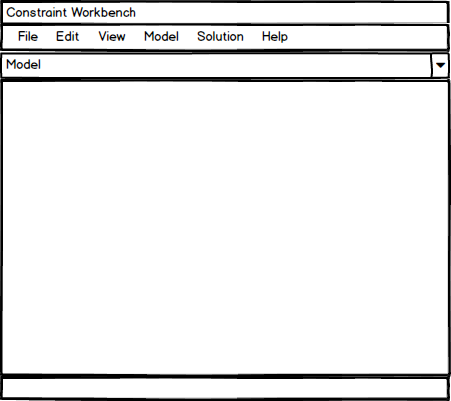
User Interface Design
The current design where there are three separate displays that can only be displayed one at a time. If the user wishes to move from the model to the visualizer design they must select the same from the display selector combo box below the main menu in the main window.
Ideally the model display should be merged into the visualizer display. The visualizer display would retain its ability to display in either design or view mode. Perhaps the display could utilize a split screen so that both modes could be seen at the same time. The visualizer display would probably need to be renamed to something more appropriate. Maybe just workspace display?
Application Menu
I need re-design the existing old school Windows main menu. Ideally a new Office ribbon would be implemented but I suspect that there isn’t sufficient functionality in the Workbench to justify it in the 0.5 milestone and implementation wise it would take more time than I have available.
The UI design changes should make the main menu a lot simpler given the removal of a lot of modality from the application views. The application will look a bit dated but I’m not too concerned with that. The aim of the prototype is to explore the application space to see if there’s a useful application there not to push the boundaries of user interface design.
External Data
If the program is to be used to solve real problems, the chances are that it will need to be able to read data created outside of itself. Data in the form of a table connected to some kind of external data like a CSV file or Excel file would be the obvious place to start. Although, perhaps an input table could be implemented first that requires only manual data input. Once the manual data input table is built it won’t take long to populate it from an external source like a CSV file.
The table will require the following features:
- Insert a column before or after selected column
- Insert a row before or after of selected row
- Edit column title
- Edit cell content which will be limited to just text
- Delete selected row
- Delete selected column
Summary
Whilst the 0.5 milestone will not build a releasable product, it will go a long way towards making one. At the very least it will build a workable prototype so that a decision can be made about whether Workspace is something worth building into a product.